The IE_IN and IE sheets are essential for tracking and analyzing historical income and expenses. These sheets automate data flow between the different sections of your Valcre workbook, allowing for a seamless integration of financials from historical revenue to future projections. By setting up the income and expense categories correctly, you ensure consistency and accuracy across the workbook, ultimately improving your property valuation accuracy.
Prerequisites
- Valcre Subscription: Professional or Enterprise
Table of Contents
Video Guide
This video will demonstrate using the Operating Historicals tabs (IE_IN & IE).
Please note that the platform has been updated since the formation of this video, the process and steps are the same, however the product may look slightly different.
Written Guide
IE_IN sheet
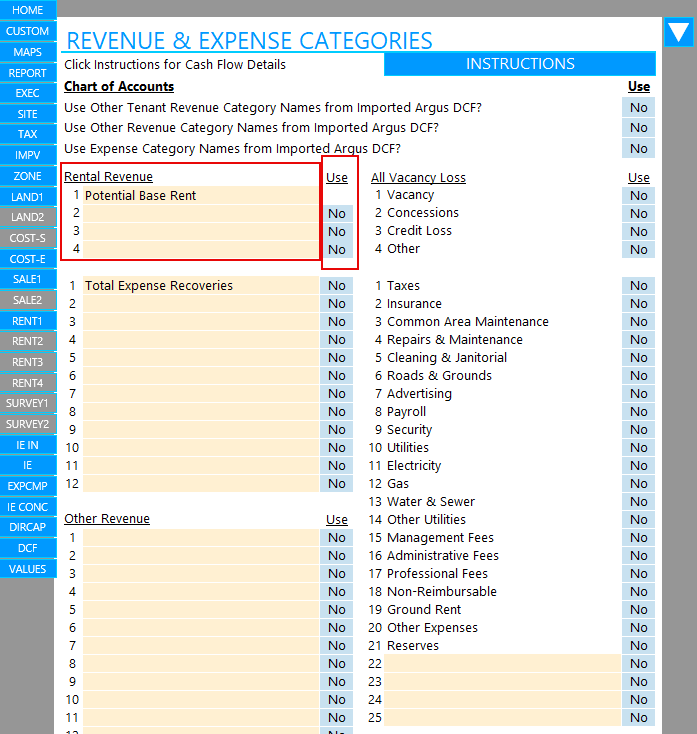
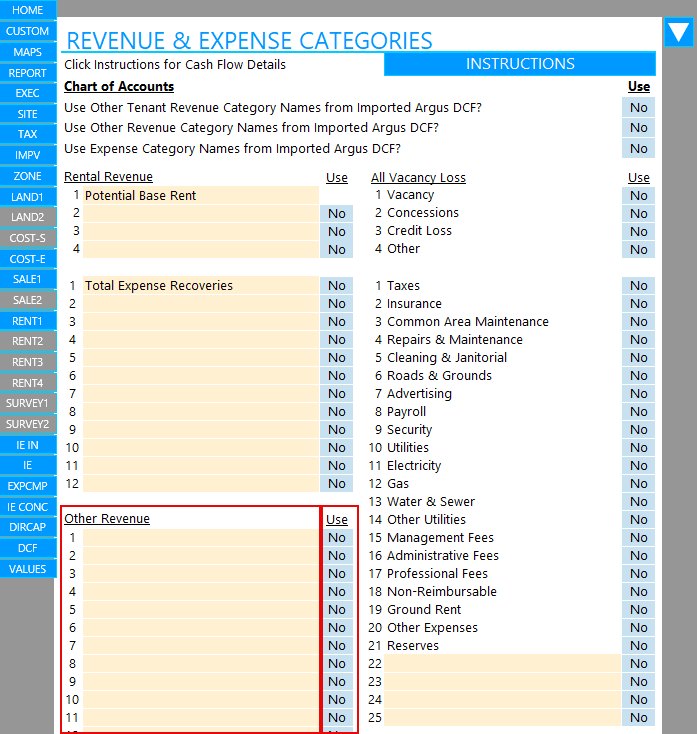
Revenue & Expense categories chart
Step 1: Access the IE_IN sheet
- Select IE_IN from the bottom or left side navigation menu.
Step 2: Set-up the IE_IN sheet
- These categories are predefined based on the property type selected. You can choose which categories are in use, allowing you to tailor the analysis to your property.
Pro Tip: Some rows are automatically hidden for DCF, C-Store, or Multi-Family properties, depending on the setup from the Home sheet. You don’t need to manually unhide these rows unless desired.
-
For DCF, C-Store, or Multi-Family Properties:
-
Select the applicable chart of accounts to add them to the table.
-
If working with multi-family, import HUD Form 92274. This will create a new sheet for entering form information.
-
Select the applicable chart of accounts to add them to the table.

Step 3: Enter Rental Revenue:
-
Rename this field as applicable and select Yes from the drop-down for all Rental Revenue items you wish to include in your analysis. These items will flow through to the Operating Historicals chart in the IE sheet.
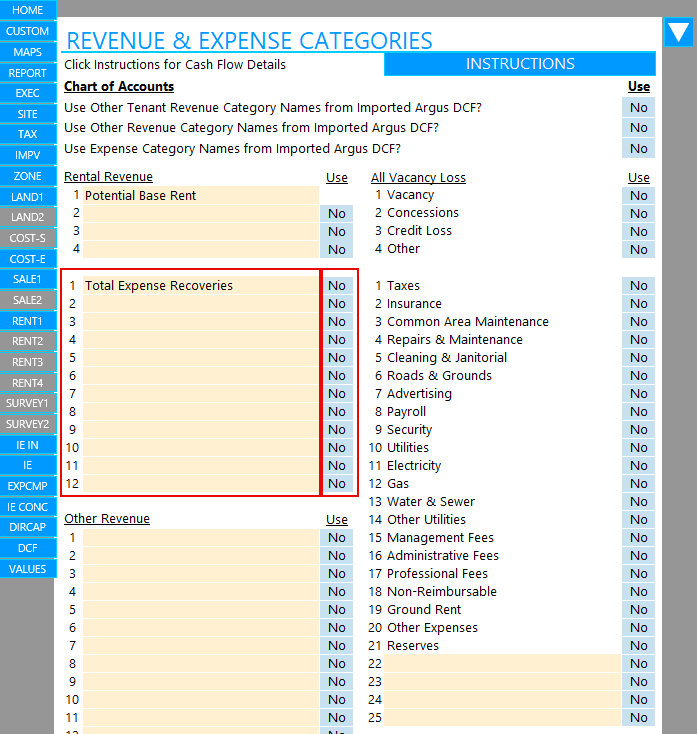
Step 4: Reimbursement Items:
-
Enter reimbursement items and select Yes from the drop-down to indicate that these will be used in your analysis. These will appear in the Operating Historical chart and other relevant sections like Expense Comparables and Direct Cap.
Step 5: Miscellaneous Items:
-
Enter any miscellaneous items and select Yes from the drop-down. These will be reflected throughout the workbook.
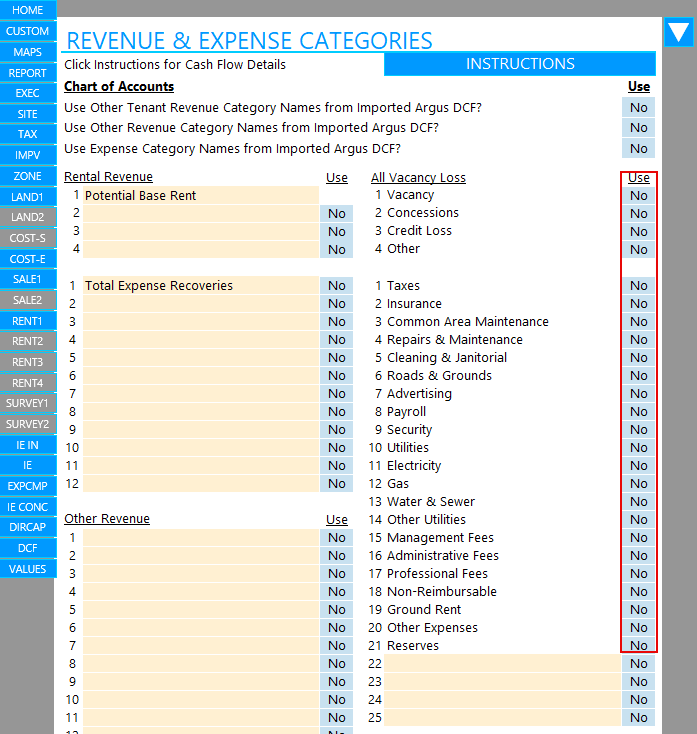
Step 6: Vacancy & Operating Expense Categories:
-
Choose which categories to use by selecting Yes from the drop-down.
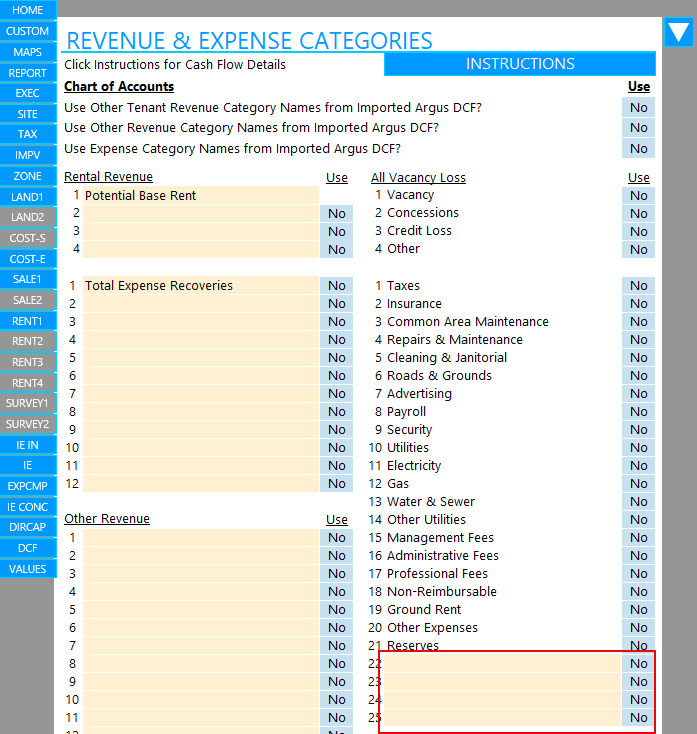
Step 7: Custom Items (Optional):
-
Add custom items in the yellow-shaded fields at the bottom of the sheet and select Yes to include them in your analysis. These will appear in the Operating Historical section of the IE sheet.
Revenue History Table
Step 1: Show/Hide Revenue Years:
-
Select No for any years you wish to hide. By default, all years are displayed as Yes.
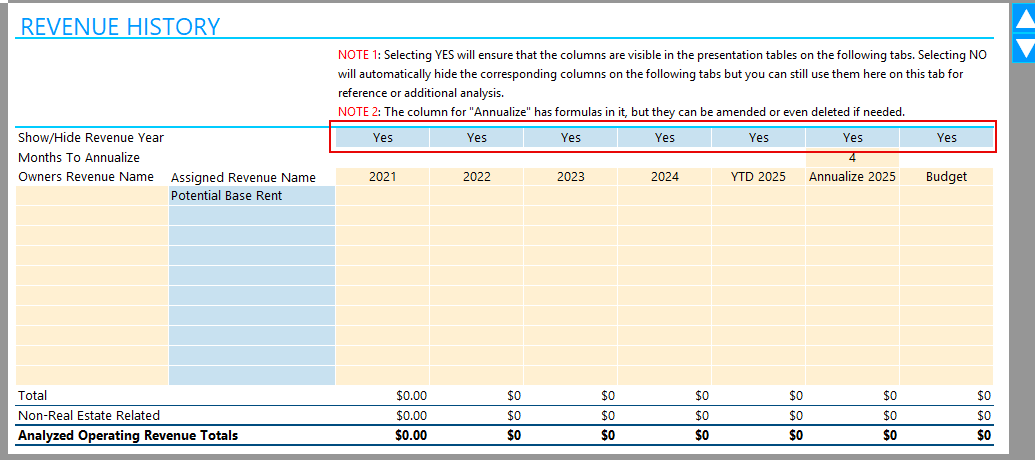
Step 2: Enter Historical Income Data:
|
Column 1: Enter the owner's operating historicals as per their terminology. |
|
|
Column 2: Assign how you’d like to categorize them. |
|
|
Column 3+: Add applicable amounts. |
|
|
The bottom section will calculate totals, factoring in non-real estate-related items to generate the Analyzed Operating Revenue Totals. |
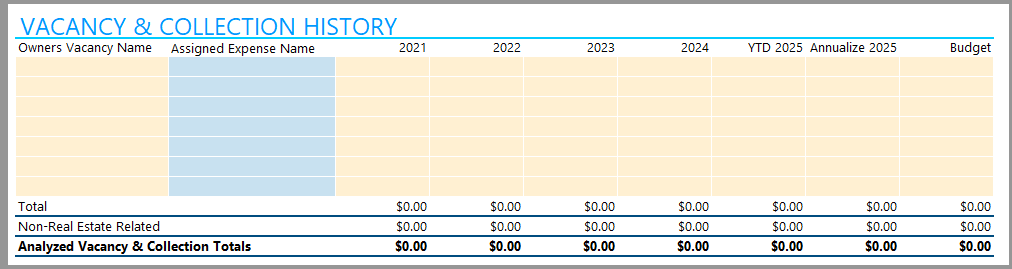
Vacancy & Collection History
Enter applicable vacancy and collection history data to track occupancy rates and collection patterns over time.
Expense history
Enter the various expense categories and corresponding figures for historical analysis.
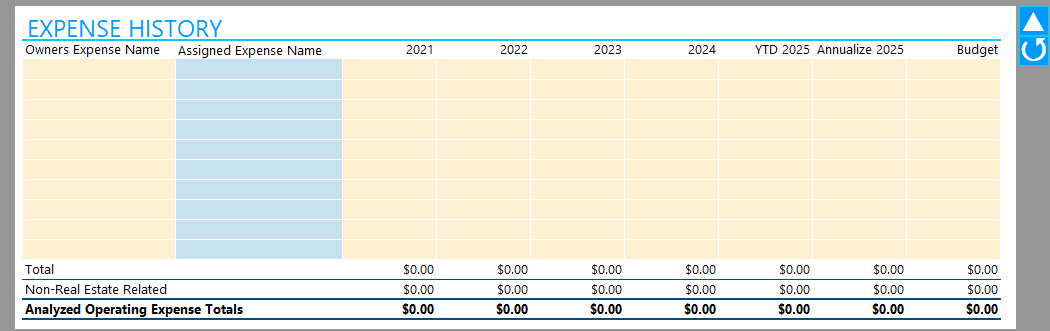
Pro Tip: Need additional rows? Select Show More Rows to expand the table and add more data.

All the data from these tables will automatically flow into the Revenue & Expense Operating History chart on the IE sheet.
IE sheet
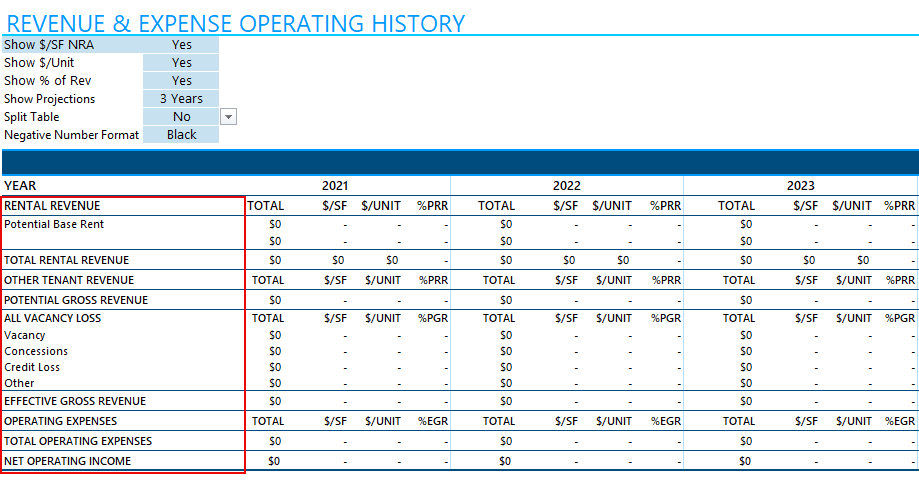
Once the IE_IN sheet is completed, the revenue & expense operating history will appear on the IE sheet. You will need to finish setting up the chart as follows:
Step 1: Access the IE sheet
- Select IE from the bottom or left side navigation menu.
Step 2: Set up the sheet
All information on this sheet is brought from the IE_IN sheet inputs. You will need to set up how you wish to best present the data for your analysis.
|
Show Price per Square Foot (NRA): Select Yes/No from the Show $/SF NRA drop-down to display the price per square foot. |
|
|
Show Price per Unit: Select Yes/No from the Show $/Unit drop-down to display price per unit. |
|
|
Show Percentage of Revenue: Select Yes/No from the Show % of Rev drop-down to display the percentage of revenue. |
|
|
Show Projections Allows you to add up to 3 years of projections Select No or the number of years you wish to display projections for. |
|
|
Split Table Select Yes to split the table into two sections |
|
|
Negative Number format Select Black (default) or Red for how you wish to present negative numbers. |
Common Issues and Troubleshooting
-
Missing Data After Setup: Ensure that the correct property type is selected in the Home sheet. This automatically triggers the visibility of relevant rows and sheets.
- Error in Historical Data Totals: Double-check your entries in the Revenue History Table to make sure all amounts are correctly entered. The totals section will provide an analysis of your figures.
| Continue Learning about Valcre with our next suggested guide: Valcre Workbook: Using the EXPCMP - Expense Comparables sheet. |
Additional Questions? Valcre Support is ready to help with all your Valcre product questions! You can connect to us via phone, email, or chat!
Comments
0 comments